Traffic.
Traffic is the lifeblood of websites. Without people seeing your website, it's just another piece of litter at the side of the Internet super-highway.
Digressing slightly, I really hate the term "Internet super-highway". It has a real dot com boom feel to it. It's the sort of term the media used when the online world was new and exciting and and everything that wasn't electronic was going to become extinct.
Moving swiftly on…
There are plenty of ways to get more traffic. Whole websites and online communities are devoted to it. When starting out, it's easy to just look at what free options are available. After all, why pay for traffic when you can get it for free?
The thing is, you may never find something better if you don't experiment with the available options.
I decided to try it out.
This is part one of a two part series that covers an experiment I ran during September.
The Setup
The idea behind the challenge was as follows:
"If I had $19.95 to spend on advertising and I had to do everything myself, what would give me the greatest return on investment?"
Why $19.95? It seems to be the common price for a single Indie game, so it would make it easier to see what percentage of a sale went on advertising. It also meant I wouldn't break the bank if things went wrong.
The "everything else" clause served two purposes. The first was to stop myself from spending money on advert designers. The second, and perhaps most important, was to act as an excuse in case the ads didn't perform particularly well.
Finally I picked several forms of "free" advertising to try to see how they compared. I couldn't use the $19.95 benchmark for these, but I needed some form of limit so I used "time". My limit was thirty minutes a day on each method. That's not a particularly long time, but I didn't really want to devote a full eight hour day to commenting on blogs and forums.
Here's the list of paid and unpaid advertisers I settled on:
Paid Advertisers
- Google AdWords – AdWords appear on nearly all Google search results pages, and AdSense is shown on a huge amount of other websites.
- Text Link Ads – TLA sell text links on other sites that are designed to increase your search engine rankings as well as generate clicks.
- Project Wonderful – Project Wonderful sell banner ads in a variety of shapes and sizes. Advertisers bid on different slots, and the highest bidding adverts are displayed.
- StumbleUpon – Users install a browser toolbar, and are given random sites that will appeal to them when they click the "Stumble" button.
Free Advertising
- LinkReferral.com – Place your link within a directory, and increase your rankings by participating in the community.
- Forum posts – Make a post on a forum advertising your site and get traffic (and flames). I didn't want to spam people, so I kept this to links in my profile and signature.
- Blog comments – Find interesting blog posts that are related to your website and leave a comment.
- Free banners – Square images that flash and generally annoy. Gain exposure by generating ad impressions and clicks.
- Link bait – Articles deliberately crafted to attract attention.
So there we have the basics of the experiment. $79.80 to spend on four advertisers, and just under three hours a day to spend promoting the site.
Measuring the Results
It wouldn't be much of an experiment without measuring the results. At the very least I needed to measure where visitors were coming from, but it would also be handy to know what they were doing once they arrived.
Most web-hosting comes with weblog analysis built in, usually Webalizer or AWStats. Several third-parties offer a more visual approach to visitor tracking, such as Crazy Egg and Google Analytics.
I decided to use Analytics to monitor where people were coming from, and Crazy Egg to see what they were doing once they arrived at the index page. Webalizer kept a watchful eye on the blog, but as the blog wasn't my main focus I left it out of my main tracking.
What happened?
The full results of the experiment are revealed in part two, including how many hits each source generated and how much they cost per click. There's also a rundown of how the free advertising performed.
There will also be charts like the one below. If that doesn't get you excited, I don't know what will…
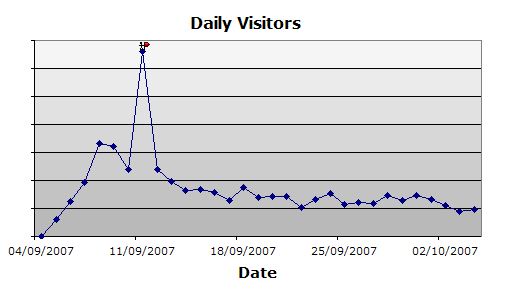
To give an idea of how things looked before, the following heat map was generated from 56 days worth of data before the test. That's 1784 front page visits and 560 clicks, if you're interested in precise figures.
Click the preview below for the full image.
In total, the experiment generated an additional 2261 visitors in 30 days. Where did they come from, and what did they do once they arrived? All is revealed in part two…
6 Comments
Sounds interesting. Unrelated, but you should link the sodaware.net logo at the top of this blog listing. I think the main site has that linked, but that the blog doesn't seem to.
Cheers JB, I hadn't noticed that little problem so it's all fixed now.
Project Wonderful Talk
Getting Traffic That Works - Sodaware
OGHME COMICS
WebComic Planet - Project Wonderful for Beginners Part One